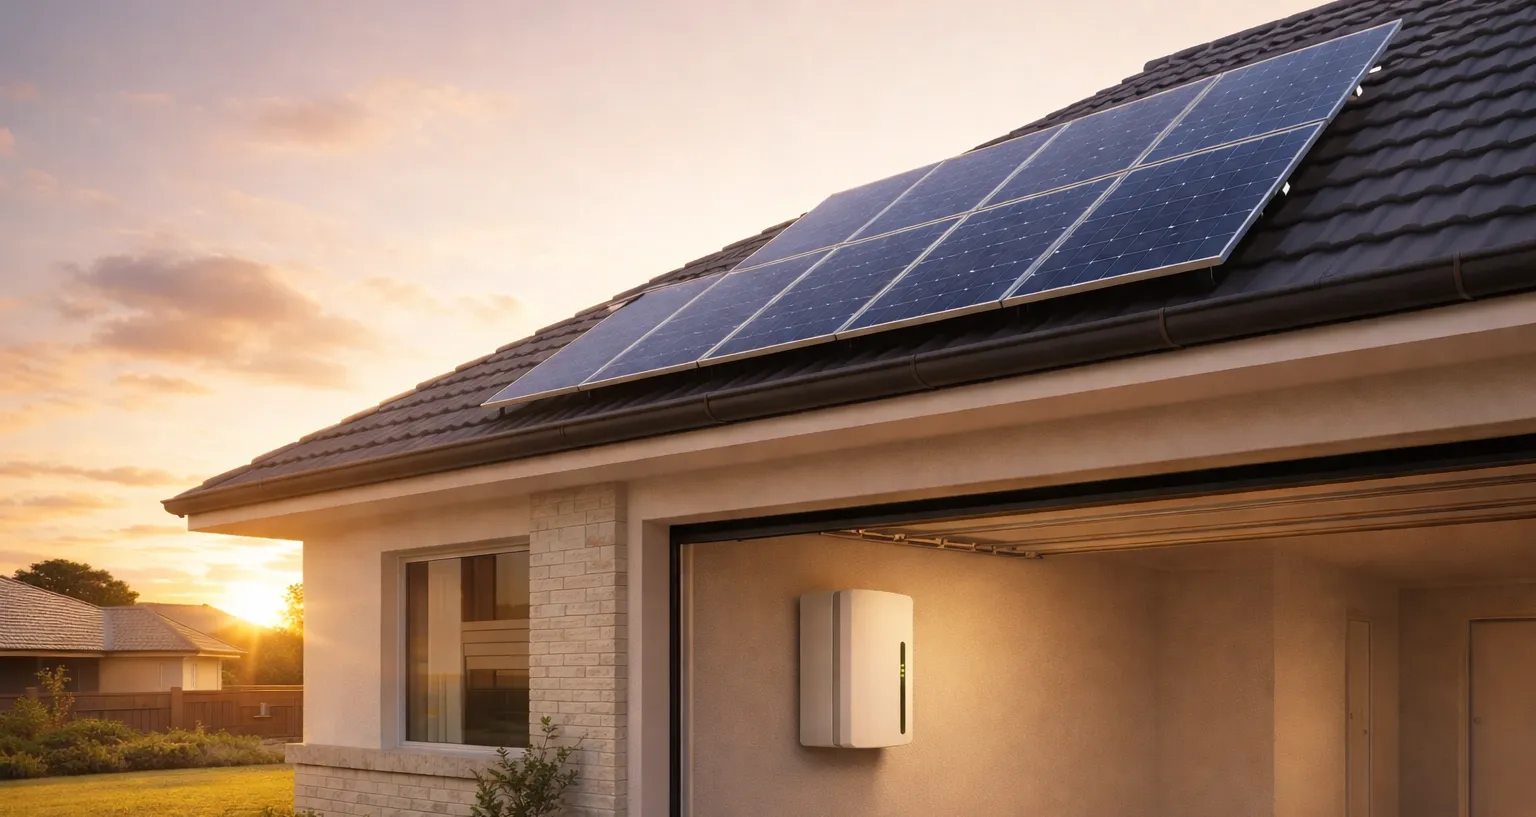
Average residential solar power system prices dropped to $1.63 per Watt during July equal to the low of April 2016 and close to the big low of $1.59 per Watt seen in December of 2015. The fall in solar PV prices applied to all system kW sizes. Perth has the best solar deals in Australia with some of the best prices for systems 2kW right through to 10kW and above.
Average solar PV system prices for July 2016
| State | 1.5kW | 2kW | 3kW | 4kW | 5kW | 10kW |
|---|---|---|---|---|---|---|
| SA | $3,273 | $3,670 | $4,714 | $5,760 | $6,779 | $14,237 |
| QLD | $2,942 | $3,604 | $4,307 | $5,278 | $6,211 | $13,922 |
| ACT | $3,695 | $4,174 | $5,275 | $6,224 | $7,155 | $14,332 |
| TAS | $4,088 | $4,797 | $6,455 | $7,746 | $8,771 | $16,082 |
| VIC | $3,485 | $3,877 | $5,098 | $6,231 | $7,273 | $14,051 |
| NSW | $3,094 | $3,624 | $4,538 | $5,459 | $6,288 | $13,115 |
| WA | $2,331 | $2,742 | $3,573 | $4,487 | $5,226 | $14,986 |
| Average | $3,718 | $4,285 | $5,398 | $6,463 | $7,524 | $15,309 |
Solar PV System Prices per Watt july 2016
All prices in the table below include the federal STC incentive which installers ordinarily include in final system prices. GST is also included.
| Location | 1.5kW | 2.0kW | 3.0kW | 4.0kW | 5.0kW | 10kW |
|---|---|---|---|---|---|---|
| Sydney NSW | $2.01 | $1.76 | $1.49 | $1.34 | $1.25 | $1.30 |
| Canberra ACT | $2.42 | $2.06 | $1.73 | $1.53 | $1.41 | $1.42 |
| Melbourne VIC | $2.23 | $1.89 | $1.65 | $1.51 | $1.42 | $1.39 |
| Hobart TAS | $2.68 | $2.34 | $2.10 | $1.90 | $1.72 | $1.59 |
| Adelaide SA | $2.13 | $1.79 | $1.53 | $1.41 | $1.32 | $1.42 |
| Perth WA | $1.55 | $1.37 | $1.19 | $1.12 | $1.05 | $1.50 |
| Brisbane QLD | $1.88 | $1.73 | $1.41 | $1.29 | $1.21 | $1.38 |
| Average | $2.13 | $1.85 | $1.59 | $1.44 | $1.34 | $1.43 |