Solar Energy provides many benefits for the environment, this article focuses on the financial feasibility of installing solar power on a residential rooftop.
Article provided courtesy of Solar Choice
Solar Energy provides many benefits for the environment, this article focuses on the financial feasibility of installing solar power on a residential rooftop.
How much do solar panels cost?
Solar Choice publishes a solar price index each month with the current pricing state by state, for different system sizes. The pricing the below table includes the upfront STC rebate provided by the federal government but excludes any additional state incentives like the Victorian Rebate Scheme.
| 1.5kW | 3kW | 4kW | 5kW | 6kW | 7kW | 10kW | |
|---|---|---|---|---|---|---|---|
| Adelaide SA | $2,510 | $3,110 | $3,490 | $3,730 | $3,840 | $5,160 | $7,660 |
| Brisbane QLD | $3,130 | $3,890 | $4,550 | $5,120 | $5,450 | $7,070 | $9,810 |
| Canberra ACT | $2,730 | $3,360 | $4,080 | $4,540 | $4,940 | $6,340 | $8,940 |
| Darwin NT | $4,860 | $6,950 | $7,930 | $9,510 | $10,180 | $10,990 | $14,100 |
| Hobart TAS | $3,170 | $4,040 | $5,050 | $5,600 | $7,030 | $8,420 | $13,570 |
| Melbourne VIC | $3,070 | $3,830 | $4,370 | $4,870 | $5,520 | $7,240 | $10,360 |
| Sydney NSW | $3,090 | $3,630 | $4,110 | $4,510 | $5,120 | $6,570 | $8,880 |
| Perth WA | $2,460 | $2,550 | $3,190 | $3,120 | $3,470 | $5,420 | $9,100 |
| All | $3,128 | $3,920 | $4,600 | $5,130 | $5,690 | $7,150 | $10,300 |
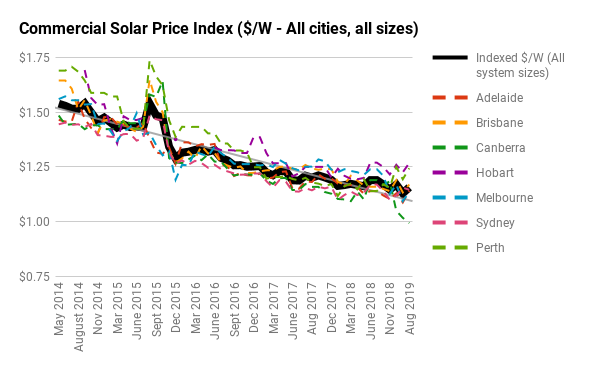
History of Solar Panel Prices
In the early days (pre 2010) Solar cost $5 to $10 per watt and was really only taken up by the early adopters with greater financial means. The popularity of solar has been driven in part by the decreasing costs and also by an attractive federal STC scheme which offers up to 40% of the cost of the system via a government incentive. Over the last 5 years solar prices have continued to decrease dramatically as product manufacturers have reached economies of scale with production and as installation methods have been streamlined. Solar Choice’s price index has been recorded monthly since 2012 where solar was almost 3 times more expensive.
Future Solar System Prices
Many people in the solar industry expect the price of solar systems to continue to decline at a much slower pace. Improvements in cell efficiency and panel designs continue to improve the way solar can deliver benefits but most of the costly production processes have already been rebuilt and benefits passed through to consumers.
How do you benefit from solar panels (financially)
Ignoring the environmental benefits for a moment, there are 2 main ways in which a home solar system offer benefits, both of which have the effect of reducing your energy bill.
1. Offsetting your energy consumption
The primary way in which solar can help you tackle your energy costs is by reducing the amount you need to buy from your electricity retailer which typically will cost between 20-40c per kWh. Solar systems are installed with the smarts that tell your appliances to use solar power first before ‘buying’ energy from the grid. This is usually referred to as ‘self-consuming’ your solar energy.
2. Feed in tariff for excess energy
However the energy generated by your solar system is dictated by the sun’s irradiance not your energy consumption so there will be times when excess energy is created and can be sold back to the grid for a rate called a ‘feed in tariff’. The value received for this vary state by state in Australia you can usually find a feed in tariff between 8-15c per kWh. Your ability to access a feed in tariff is usually limited to a maximum solar system size – for a full explanation of what is possible state by state read this guide.
Payback Periods for Solar
To determine the payback period for your solar system we recommend using the Solar Choice payback period calculator and entering the specifics of your case. As a quick guide we have created the below table using some conservative assumptions for a typical residential scenario with a 5kW solar PV system:
| Average price for 5kW solar system | Price of electricity ($/kWh) |
Solar feed-in tariff ($/kWh) |
Payback period (years) |
Internal rate of return | |
| Adelaide | $3,730 | $0.34 | $0.11 | 3.4 | 30% |
| Brisbane | $5,120 | $0.23 | $0.15 | 4.2 | 23% |
| Canberra | $4,540 | $0.21 | $0.08 | 6.0 | 15% |
| Darwin | $9,510 | $0.26 | $0.24 | 4.7 | 21% |
| Hobart | $5,600 | $0.26 | $0.09 | 7.2 | 13% |
| Melbourne | $4,870 | $0.25 | $0.12 | 5.3 | 18% |
| Perth | $3,120 | $0.27 | $0.07 | 3.7 | 27% |
| Sydney | $4,510 | $0.25 | $0.11 | 4.9 | 20% |
| Average | $6,523 | $0.25 | $0.12 | 5.8 | 18% |
-
- Electricity rates & feed in tariffs based on middle ground of what’s available
- Assumed that 50% of Solar Energy is used by the home (self-consumption rate)
- Panels are tilted to the North at 30% pitch
- Inflation at 2.5% and a 5% discount rate
Conclusion: Solar is worth it financially
As you can see, for most Australians they can install solar and have the system pay for itself within 6 years. Then they can benefit from free energy on the roof and an income stream from energy sold back to the grid offering overall a great return on investment.
In addition, they can be proud like us at Solar Choice of taking responsibility for their carbon emissions and being a part of the clean energy revolution.